# A few tips for working on high-surface-area problems
Johno Whitaker
2024-04-12
> **A note from Johno**
>
> I’ve been writing brief notes on my [own
> blog](https://johnowhitaker.dev/all) for years. I’ll be posting on the
> Answer.AI blog too now that I work here – here’s what is hopefully the
> first of many posts. This one is just a few thoughts inspired by some
> recent work, which I hope you’ll find interesting. I’d love to hear
> what you think; you can find me [here on
> Twitter/X](https://x.com/johnowhitaker).
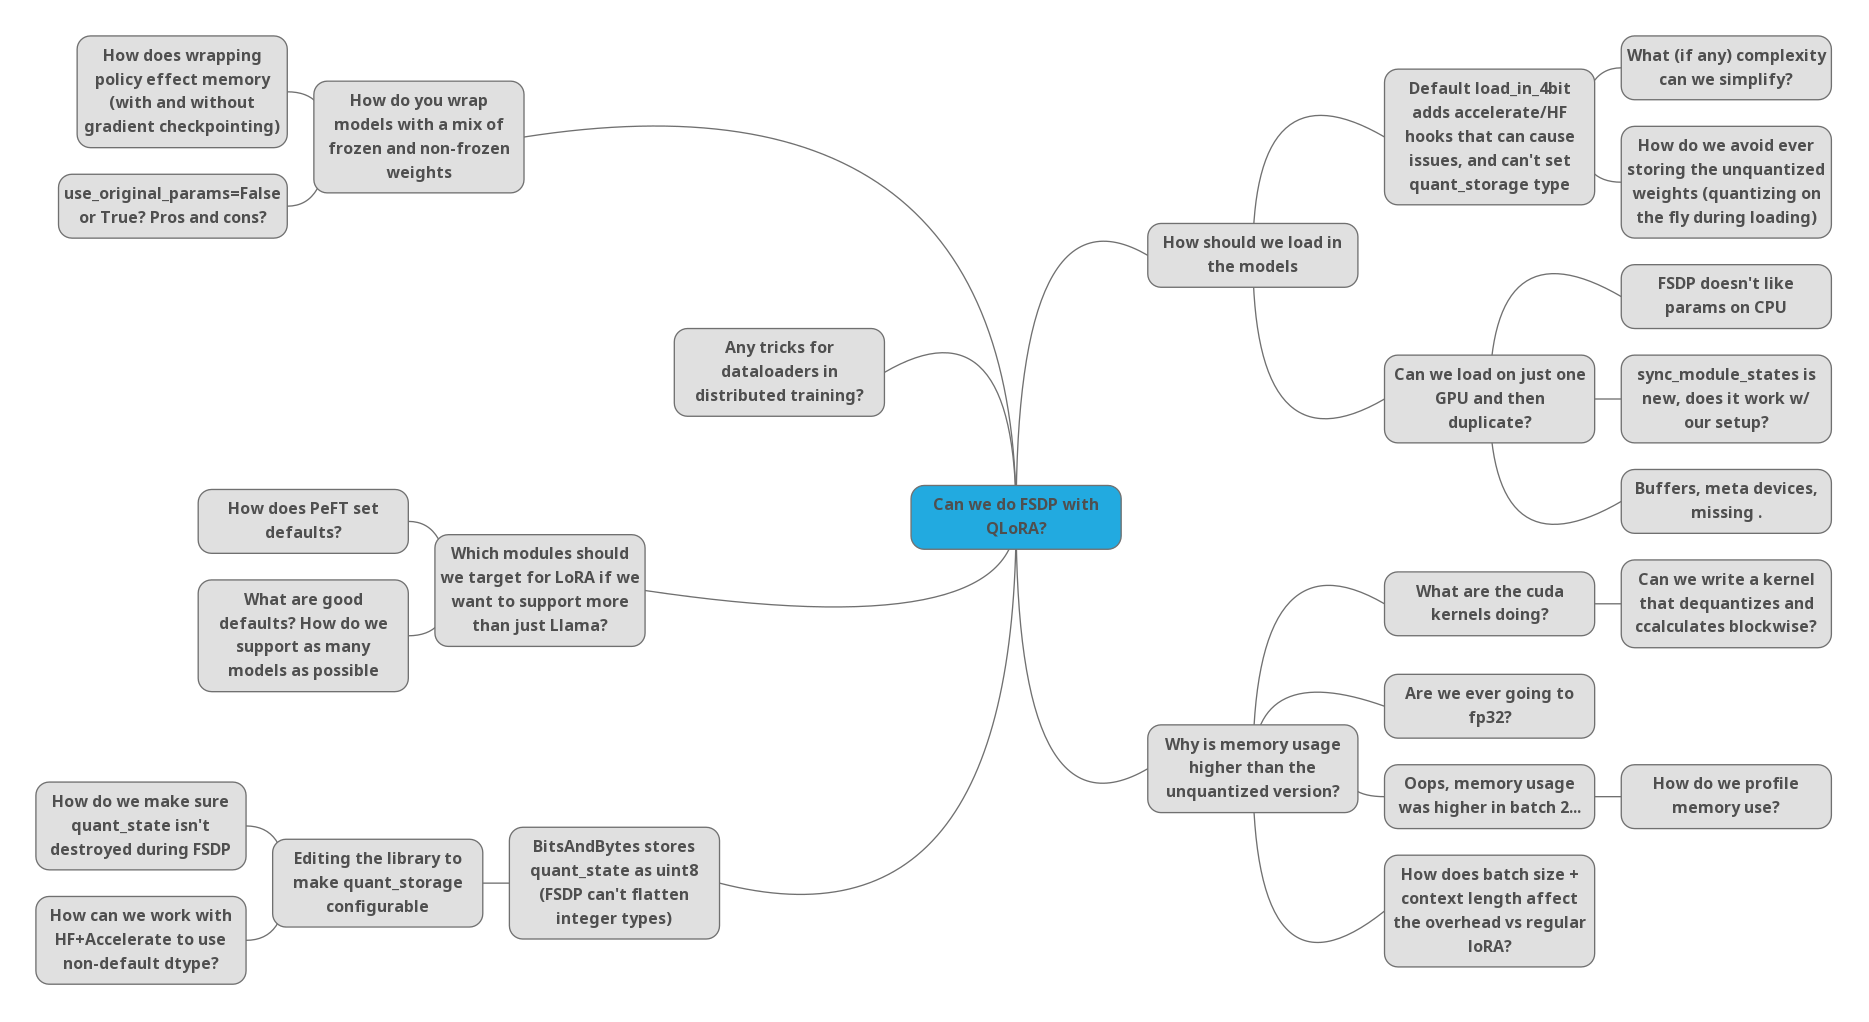
Some of the many questions/directions we
faced when trying to get QLoRA working with FSDP - an example of a
high-surface-area problem!
Some problems are fairly well-defined and narrow in scope: ‘translate
this maths into code’, or ‘try a different embedding dimension on this
task’. But as AI researchers we often work on things that involve a lot
of moving pieces, and when something doesn’t work it can be hard to find
out **where** the issue(s) may be, let alone what we need to do to fix
them. I think of these tasks as having a high “surface area”, and in
this post I’ll share a few tips for dealing with these inspired by a
recent experience with one such problem.
## Tip 1: Start with a minimal example and build up
Rather than beginning with the full, complicated task, see if there’s a
smaller version you can create that still lets you meaningfully probe
the problem. For example, rather than using Llama-2-7B with LoRA
adapters, I did some early tests with a network made of blocks like
this:
``` python
class Block(torch.nn.Module):
def __init__(self, size=512):
super().__init__()
self.l1 = torch.nn.Linear(size, size)
self.l2 = torch.nn.Linear(size, size)
for param in self.l2.parameters(): param.requires_grad = False
```
Starting small lets you add bits of complexity one at a time, gradually
revealing different aspects of the problem. With this small example I
could experiment with and isolate specific aspects of the larger
challenge - for example, swapping out one linear layer with a quantized
version. The goal here is to reduce the surface area that is in focus at
a given time, and incrementally add more as we figure things out.
## Tip 2: Log/instrument everything
Debugging something opaque is a pain, so anything that provides more
visibility into what is happening is useful. Printing out tensor shapes,
logging losses, gradients and resource usage, and generally
instrumenting everything that you possibly can are gifts to your future
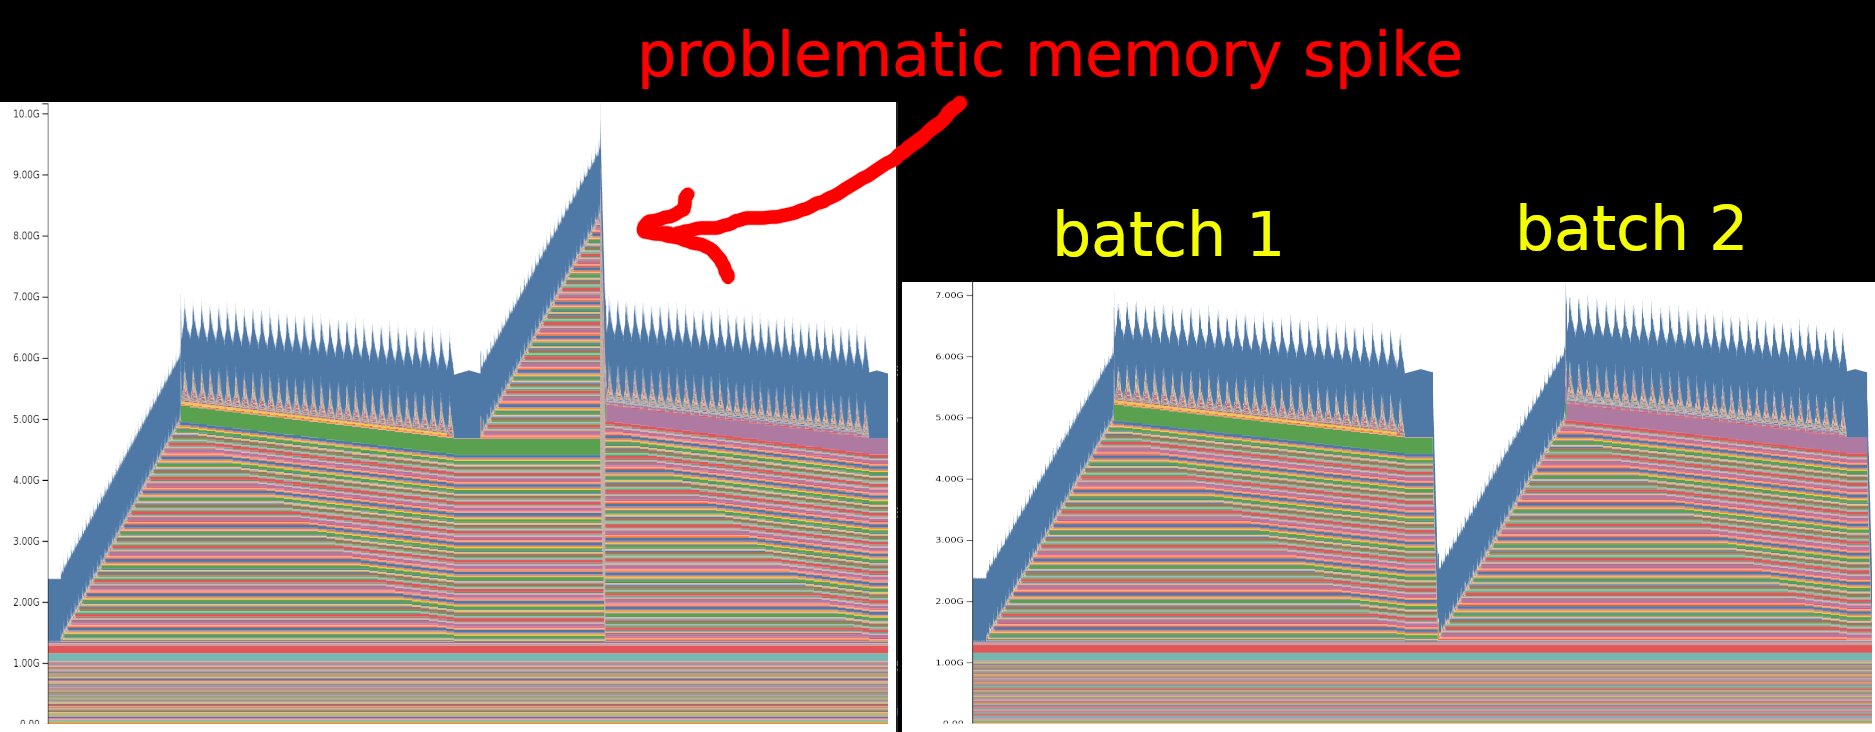
self here. For example, consider the following two memory profiles
captured with [this excellent pytorch
tool](https://pytorch.org/docs/stable/torch_cuda_memory.html):
Saving a snapshot of memory use over two
successive batches of training data reveals an unexpected spike in
memory (left) until a fix is put in place (right)
In this case, a somewhat sneaky bug had crept in, causing memory usage
to spike in the second batch of training. Printing the memory use at
different stages helped show that something funky was going on, but it
was only through a combination of memory profiling and a minimal example
that I was able to spot the issue. I hadn’t used this memory
visualization tool before - it’s only a few months old, and I hadn’t
heard of it until a colleague suggested it. Imagine all of the pain that
could be saved if more AI researchers used tools like this!
Whether you’re on team “inspect it manually in a debugger”, team “print
all the things” or team “log to W&B and call that good”, make sure you
have *some* way to see more of what is actually going on wherever
possible :)
## Tip 3: Teamwork FTW
Explaining a problem is an excellent debugging tool, even if the
explainee doesn’t actually contribute any new knowledge - hence the
excellent [“rubber duck debugging”
technique](https://en.wikipedia.org/wiki/Rubber_duck_debugging).
However, team members with deep complimentary knowledge are even better
than a mute duck, and talking through things rather than suffering in
silence almost always pays off and leads to a quick solution. If you
don’t have formal work colleagues, sharing in public forums or pestering
your technical friends is often just as good.
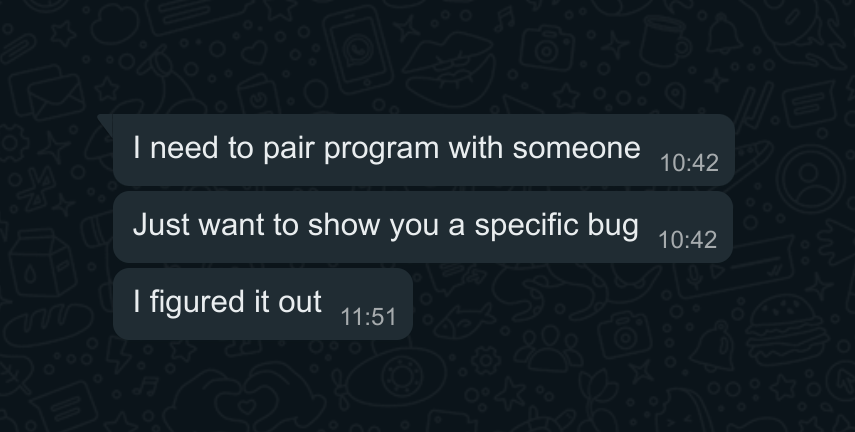
A missed opportunity for some instructive
pair programming with a friend.
Another benefit of working with a team is the ability to divide and
conquer when one ‘problem’ turns out to be many sub-problems in a trench
coat. This one plays nicely with Tips 1 and 2 - if you’ve got
well-instrumented minimal examples it’s a lot easier to identify
specific issues, and have others work on them without needing to
front-load the full complexity of the task.
## Tip 4: Refactor repeatedly to surface + eliminate complexity where possible
Software complexity tends to grow over time. Features get added, chunks
of code get split into different files and made more modular, options
proliferate as more and more configurations are supported… All of this
may be perfectly reasonable, but can make it difficult to understand a
specific circumstance. Focusing on one task and bringing as much of the
code as possible into a single notebook or python file can be a great
tool for debugging, forcing you to read the important bits as they get
refactored out of their silos and into your new version.
You may worry that the state-of-the-art deep learning techniques are
beyond you. Worry not! Beneath all the layers there are almost always
fairly simple pieces. For example, consider the case of applying LoRA
adapters to a model. I had to do this for a
[video](https://www.youtube.com/watch?v=gJ4bvOX-1CE) I was making on
diffusion models. The diffusers library implementation spans multiple
layers of abstractions and is stuffed with conditions to handle
different formats and approaches. It was only when I extracted out and
re-wrote the key step that I could properly understand it and begin to
experiment.
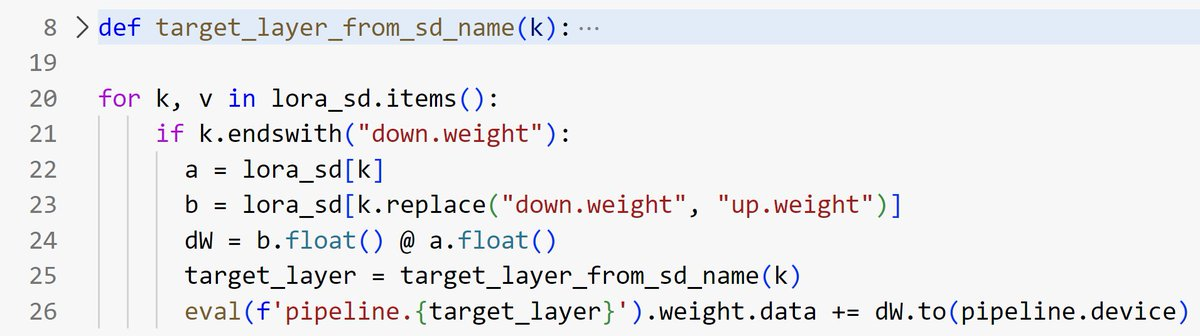
Merging in LoRA weights in a diffusion
model pipeline: minimal implementation compared to the >300LOC
diffusers version. Theirs supports far more options, but for
experimenting + debugging a minimal re-implementation was far easier to
work with and understand. Once things are working, we can always switch
back to the more complicated ‘official’ version.
Ideally, start from some minimal example and build up from there. Your
final result doesn’t need to be a permanent artefact, but having
everything in one place when working on especially thorny problems is
extremely useful. This is a skill that is hard to learn from examining
others’ code, since we typically only get a look at the final result.
Notebooks can be a great way to share the progression as you verify
things a few lines at a time before combining them into larger blocks,
but even here we usually see just the final (working) version rather
than all the intermediate pieces.
## Final Remarks
These high-surface-area problems are tough. It’s hard to get into flow
when there are so many questions that need answers, and debugging them
is often a slog rather than a flash of inspiration. The final results
can sometimes feel underwhelming compared to coming up with some flashy
new algorithm. And yet by pushing through and persevering you can have a
big impact… Hopefully this post has inspired you to do so, and given you
a few tips to keep in mind when you do.